Quick Start Guide
Get up and running with GeoFacetMakie.jl in minutes!
Basic Example
Let's create your first geofaceted plot:
using GeoFacetMakie, DataFrames, CairoMakie

# Sample data for US states
data = DataFrame(
    state = ["CA", "TX", "NY", "FL", "WA", "PA"],
    population = [39.5, 29.1, 19.8, 21.5, 7.6, 13.0],
    gdp_per_capita = [75_277, 63_617, 75_131, 47_684, 71_362, 59_195]
)

# Define a simple plotting function
function plot_population!(gl, data; missing_regions, axiskwargs...)
    # Handle empty data explicitly
    if isempty(data.population) && missing_regions != :empty
        error("No valid data points found for state $(data.state[1]).")
    end

    ax = Axis(gl[1, 1]; title = data.state[1], axiskwargs...)
    if !isempty(data.population)
        barplot!(ax, [1], data.population, color = :steelblue)
    end
end

"""
We're going to load a pre-created grid (use the function
`list_available_grids()` to see all the predefined ones that
are exported by GeoFacetMakie and are available to use),
but you can also load a grid from a CSV, including ones you
have created (see the "Grid Operations" section for more details
on the necessary grid structure and components), using the commented
out code below
"""
# grid = load_grid_from_csv("us_state_grid1")

# Create the geofaceted plot
fig = geofacet(
    data, :state, plot_population!;
    grid = us_state_grid1,
    link_axes = :y,
    figure_kwargs = (size = (800, 600),),
    common_axis_kwargs = (
        ylabel = "Population (M)",
        xticksvisible = false,
        xticklabelsvisible = false,
        xlabelsize = 12,
        ylabelsize = 12,
        xticklabelsize = 12,
        yticklabelsize = 12,
    ),
    func_kwargs = (missing_regions = :empty,)
)

fig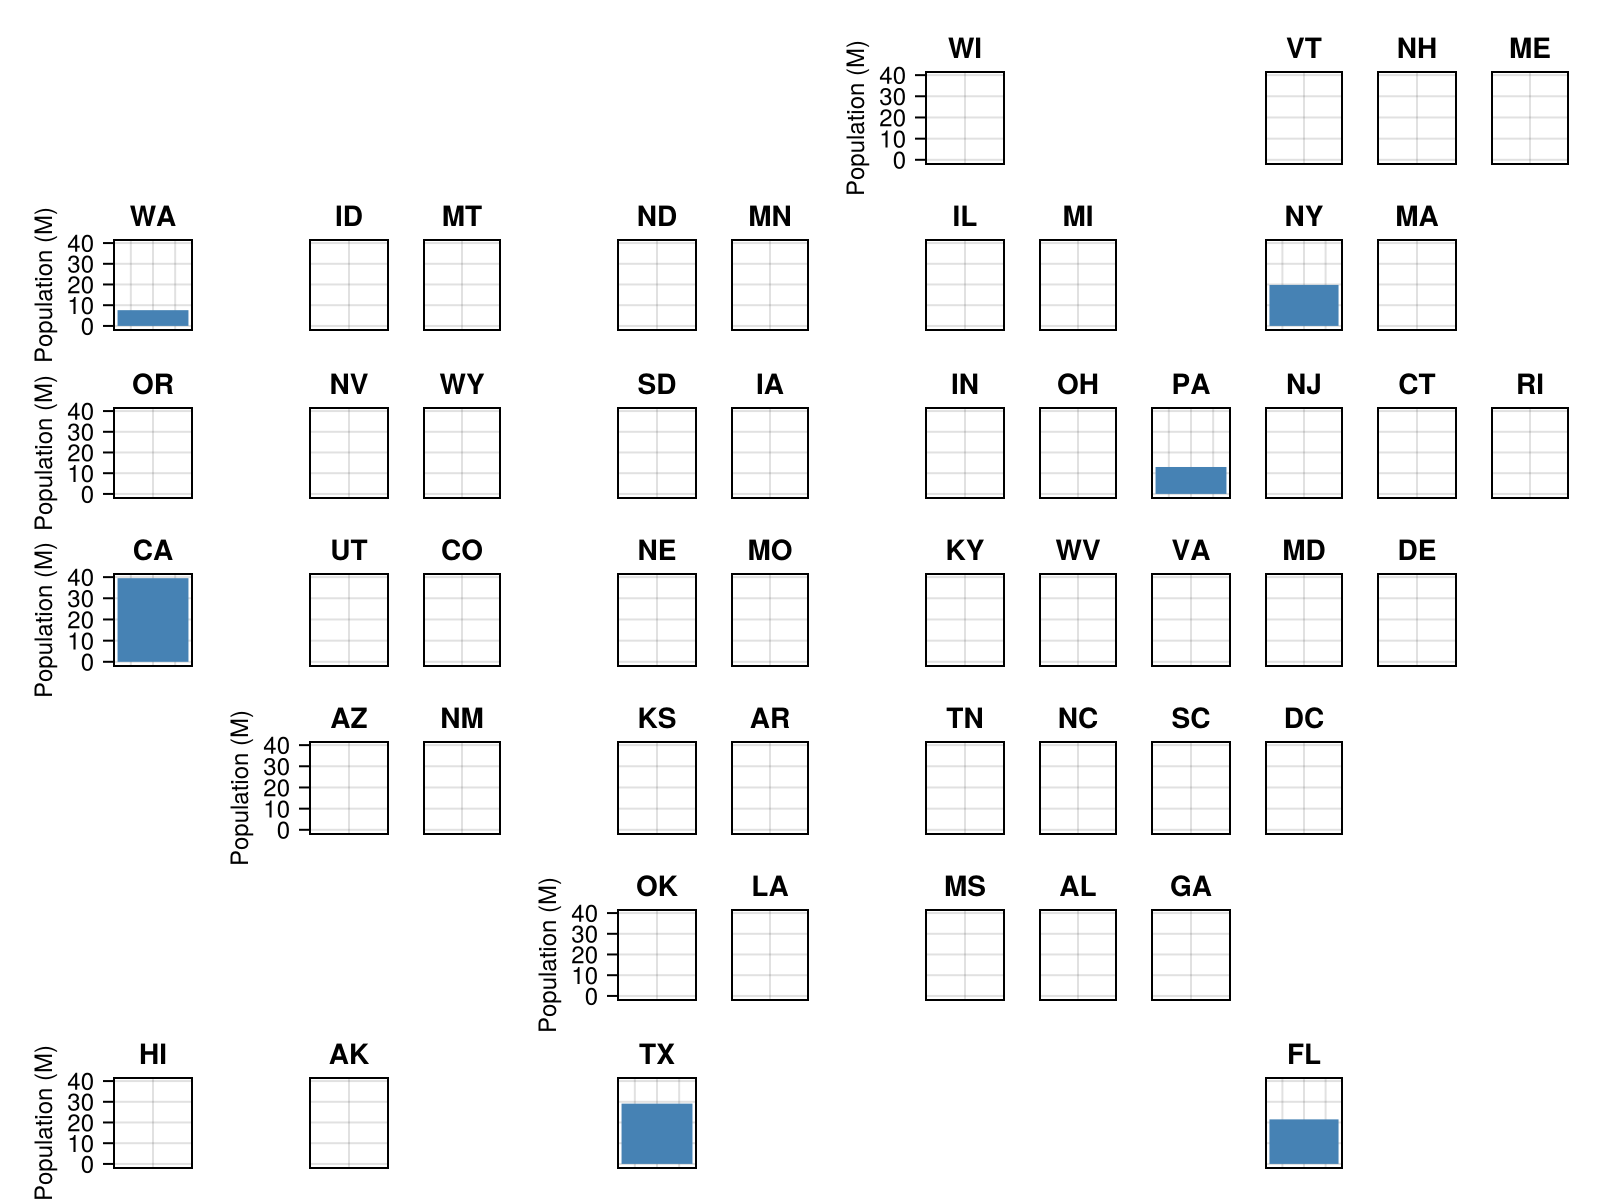
That's it! You've created your first geofaceted visualization.
Understanding the Components
1. Data Structure
GeoFacetMakie.jl works with any dataframe that can be grouped by a geographic identifier:
# Your data needs:
# - A geographic column (state, country, region, etc.)
# - One or more data columns to visualize
data = DataFrame(
    state = ["CA", "TX", "NY", "FL", "WA", "PA"],
    population = [39.5, 29.1, 19.8, 21.5, 7.6, 13.0],
    gdp_per_capita = [75_277, 63_617, 75_131, 47_684, 71_362, 59_195]
)
2. Plotting Function
The plotting function defines what gets drawn in each facet:
function my_plot!(gl, data; missing_regions, kwargs...)
    # Handle empty data gracefully
    if isempty(data.x) && missing_regions != :empty
        error("No valid data points found for region $(data.region[1]).")
    end

    ax = Axis(gl[1, 1]; kwargs...)  # Create axis in grid layout

    # Your plotting code here (only if data exists)
    if !isempty(data.x)
        lines!(ax, data.x, data.y)     # Example: line plot
    end

    ax.title = data.region[1]       # Set title to region name
end
Key points:
Function must be mutating (end with
!)Takes
gl(GridLayout),data(subset for this region), andkwargsCreate an
Axisin the GridLayoutSet
ax.titleto identify the regionHandle empty data gracefully using the
missing_regionsparameterUse the
labelwithin Makie mutating function e.g.,scatter!to add a series to the LegendLegend-specific parameters (like
markersizefor legend markers) must be handled within your function within thelabelsection
Legend Customization
When working with legends, parameters that affect legend appearance must be handled within your plotting function:
function plot_with_legend!(gl, data; missing_regions, legendmarkersize=16, kwargs...)
    ax = Axis(gl[1, 1]; kwargs...)

    if !isempty(data.x)
        scatter!(
            ax,
            data.x,
            data.y,
            color = :coral,
            markersize = 12,
            # Legend-specific styling passed separately
            label = "Data Series" => (; markersize = legendmarkersize)
        )
    end

    ax.title = data.region[1]
end

# Use with func_kwargs to pass legend parameters
geofacet(
    data, :region, plot_with_legend!;
    func_kwargs = (legendmarkersize = 20, missing_regions = :empty)
)
3. The geofacet Function
geofacet(data, grouping_column, plotting_function; options...)Required arguments:
data- Your datasetgrouping_column- Column name for geographic grouping (e.g.,:state)plotting_function- Function that creates plots for each region
Common options:
figure_kwargs- Figure size, resolution, etc.common_axis_kwargs- Axis labels, styling applied to all facets and all axes within a facet- If you have a more complicated figure with multiple axes within a facet e.g., overlaying a bar and line plot that do not share the same axis, use
common_axis_kwargsto specify axis kwargs that should be shared, and then pass Axis-specific kwargs withinaxis_kwargs_list(in the order the axes are specified withinplotting_function). See this page for an example of handling multiple axes.
- If you have a more complicated figure with multiple axes within a facet e.g., overlaying a bar and line plot that do not share the same axis, use
link_axes- Link axes across facets (:x,:y,:both,:none)func_kwargs- Kwargs should be passed to your plotting function e.g.,missing_regionshide_inner_decorations- Boolean that toggles whether to hide the inner axis decorations when it has a direct neighbor that could show the relevant axis label (defaults totrue)
Common Patterns
Scatter Plots
function plot_scatter!(gl, data; missing_regions, color, axiskwargs...)
    ax = Axis(gl[1, 1]; axiskwargs...)
    scatter!(ax, data.gdp_per_capita, data.population,
             color = color, markersize = markersize)
    ax.title = data.state[1]
end

# Load a reliable grid
grid = load_grid_from_csv("us_state_grid1")

geofacet(
    data, :state, plot_scatter!;
    grid = grid,
    figure_kwargs = (size = (800, 600),),
    common_axis_kwargs = (
        xlabel = "GDP per capita (\$)",
        ylabel = "Population (M)"
    ),
    link_axes = :both
    func_kwargs = (
        missing_regions = :empty,
        color = :coral,
        markersize = 15
    )
)
Customization Options
Figure Styling
geofacet(data, :state, plot_function!;
    figure_kwargs = (
        size = (1200, 800),      # Width x Height in pixels
        fontsize = 12,           # Base font size
        backgroundcolor = :white # Background color
    )
)
Axis Styling
geofacet(data, :state, plot_function!;
    common_axis_kwargs = (
        xlabel = "X Label",
        ylabel = "Y Label",
        titlesize = 14,
        xlabelsize = 12,
        ylabelsize = 12,
        xticklabelsize = 10,
        yticklabelsize = 10
    )
)
Axis Linking
Control how axes are linked across facets:
# Link both X and Y axes (default)
link_axes = :both

# Link only X axes (good for time series)
link_axes = :x

# Link only Y axes (good for comparing magnitudes)
link_axes = :y

# No linking (each facet independent)
link_axes = :none
Built-in Geographic Grids
GeoFacetMakie.jl includes many pre-defined grids from the geofacet collection:
# List available grids
available_grids = list_available_grids()
println("Available grids: ", join(available_grids[1:5], ", "), "...")

# Load a specific grid
grid = load_grid_from_csv("custom-grid.csv", "/directory/storing/custom-grid/")

# Use with geofacet
geofacet(data, :state, plot_function!; grid = grid)
Common US state grids include:
us_state_grid1- Standard US state layoutus_state_grid2- Alternative US state arrangementus_state_grid3- Compact US state layoutus_state_contiguous_grid1- Contiguous US only (no AK, HI)
For all available predefined grids, see here.
Error Handling
Missing Regions
Handle missing regions gracefully using the missing_regions parameter of the func_kwargs named tuple kwarg. missing_regions is forwarded to your plotting function, so your plotting function must accept it as a kwarg.
# Skip regions not in the grid - the default
geofacet(
    data,
    :state,
    plot_function!;
    func_kwargs = (missing_regions = :skip, )
)

# Show empty facets for missing regions
geofacet(
    data,
    :state,
    plot_function!;
    func_kwargs = (missing_regions = :empty, )
)

# Error for missing regions
geofacet(
    data,
    :state,
    plot_function!;
    func_kwargs = (missing_regions = :error, )
)
Your plotting functions should handle cases where a region has no data. The missing_regions parameter is passed to your function to help with this:
function robust_plot!(gl, data; missing_regions, axiskwargs...)
    # Check for empty data
    if isempty(data.values) && missing_regions != :empty
        error("No valid data points found for region $(data.region[1]).")
    end

    ax = Axis(gl[1, 1]; axiskwargs...)

    # Only plot if we have data
    if !isempty(data.values)
        lines!(ax, data.time, data.values, color = :blue)
    else
        # Optionally add placeholder text for empty facets
        text!(ax, 0.5, 0.5, text = "No Data", align = (:center, :center))
    end

    ax.title = data.region[1]
end

# Pass missing_regions through func_kwargs
# If func_kwargs is not specified, defaults to
# func_kwargs = (missing_regions = :empty,)
geofacet(
    data, :region, robust_plot!;
    func_kwargs = (missing_regions = :empty,)
)
This pattern ensures your plots handle missing or empty data gracefully while giving you control over the behavior.
Extra Regions
By default, geofacet() sets the additional_regions kwarg to :error, though it can also be set to :warn to continue with the plot and log a warning when an additional region is present in the region column of the dataframe that doesn't exist in the grid.
julia> data_with_extra_state = DataFrame(
state = ["CA", "TX", "NY", "FL", "WA", "PA", "Extra_region"],
population = [39.5, 29.1, 19.8, 21.5, 7.6, 13.0, 20.0],
gdp_per_capita = [75_277, 63_617, 75_131, 47_684, 71_362, 59_195, 60_101]
)
[1m7×3 DataFrame[0m
[1m Row [0m│[1m state [0m[1m population [0m[1m gdp_per_capita [0m
│[90m String [0m[90m Float64 [0m[90m Int64 [0m
─────┼──────────────────────────────────────────
1 │ CA 39.5 75277
2 │ TX 29.1 63617
3 │ NY 19.8 75131
4 │ FL 21.5 47684
5 │ WA 7.6 71362
6 │ PA 13.0 59195
7 │ Extra_region 20.0 60101
julia> fig_with_extra_state = geofacet(
data_with_extra_state, :state, plot_population!;
grid = us_state_grid1,
link_axes = :y,
figure_kwargs = (size = (800, 600),),
common_axis_kwargs = (
ylabel = "Population (M)",
xticksvisible = false,
xticklabelsvisible = false,
xlabelsize = 12,
ylabelsize = 12,
xticklabelsize = 12,
yticklabelsize = 12,
),
func_kwargs = (missing_regions = :empty,),
additional_regions = :error # defaults to :error - can be set to :warn
)
ERROR: ArgumentError: Additional regions in data not present in the grid provided: Extra_regionNext Steps
Now that you understand the basics:
Basic Usage Tutorial - Detailed walkthrough with more examples
Advanced multi-axis tutorial - A more complicated example with multiple axes per facet
API Reference - Complete function documentation
Need Help?
- Ask questions in GitHub Issues